30/10/2023 Papers

Riding the quiet wave: The hidden resilience of defensive stocks amidst the “Magnificent 7” surge

Key points

- We have seen the most concentrated rally for the past 25 years but the ‘Magnificent 7’ have lost a bit of their shine recently.
- Investors would be wise to consider the MSCI ACWI ex ‘Magnificent 7’ in a careful way as we approach a pivotal period for equities.
- A regime where interest rates stabilise at a high level is usually favourable to our strategies.

The rise (and fall?) of the “Magnificent 7”

2023 has not been kind to the Growth factors as rising interest rates have put huge pressure on stocks with stretched valuations. Hence, the opinion held by some investors that the tightening cycle was coming to an end acted as a strong tailwind for the fallen angels of the previous year. Additionally, the successful launch of ChatGPT by OpenAI triggered a buying frenzy on the AI theme, propelling semiconductors, in particular GPU producers like Nvidia, through the roof! The mega caps in the US, all claiming to research/develop/provide AI features in their offering, benefited from the same enthusiasm for the most concentrated market rally seen over the past 25 years as shown in Chart 1. It was even more concentrated than the Covid period and the TMT bubble.


Chart 1: Share of the seven largest contributors to MSCI USA calendar performance

Source: Unigestion, MSCI. Data as of 31.07.2023

This very narrow leadership has massively distorted the typical analysis one can undertake on which risk factors are driving the market. Indeed, when looking at style performances in the US, and computing the equivalent without the influence of the magnificent 7, the picture changes dramatically, as shown in Chart 2.


Chart 2: Performance of style factors within MSCI USA in 2023 with and without the “Magnificent 7”.

Source: Unigestion, MSCI. Data as of 31.07.2023

While the first seven months of the year have paved the way for this outstanding rally, it seems that the end of summer has been less kind to ‘big tech’, in the midst of further concerns over China, very stretched valuations in the tech space, a looming student debt cliff and an increasingly uncertain trajectory for the Fed. Hence we’ve seen the Magnificent 7 lose a bit of their shine over the past two months, as shown in chart 3.


Chart 3: Performance pattern of the Magnificent 7 and the MSCI USA in 2023.

Source: Unigestion, MSCI. Data as of 30.09.2023

Wider impact on global indices

As the Magnificent 7 reach a peak in terms of market capitalisation, the narrow leadership is being felt in the more developed indices, such as the MSCI World Index, or even the MSCI ACWI Index. But local indices without such a large exposure to the theme, such as the MSCI Europe Index and the MSCI Emerging Markets Index have lived a very different story in 2023.
Indeed, the positve performance of Quality has been much more muted across the globe when we neutralise the impact of the Magnificent 7 (chart 4).


Chart 4: Performance of the Quality factor in 2023

Source: Unigestion, MSCI. Data as of 30.09.2023

Likewise Growth has seen no positive behaviour so far when the Magnificent 7 are excluded (Chart 5).


Chart 5: Performance of the Growth factor in 2023

Source: Unigestion, MSCI. Data as of 30.09.2023

Low risk experienced fewer headwinds in US/Global markets, especially as it proved supportive in emerging markets and Europe (Chart 6).

Chart 6: Performance of the Low Risk factor in 2023

Source: Unigestion, MSCI. Data as of 30.09.2023

Likewise, Value did not suffer as much as one might have imagined, once again supported by a much better profile in non-tech US names, and in other regions.(Chart 7).

Chart 7: Performance of the Value factor in 2023

Source: Unigestion, MSCI. Data as of 30.09.2023

Hence, behind the tsunami of the Magnificent 7 which appears to be receding, a second wave – more quiet, more subtle – is currently at play. Investors would be wise to consider the MSCI ACWI ex Magnificent 7 in a careful way as we approach a pivotal period for equities.
To summarise, when setting the “Magnificent 7” apart, we see (Chart 8):

  • Growth has not performed particularly well across regions
  • Low Vol has been strong in emerging markets and ok in Europe
  • Quality is doing ok across regions, but does not show the same stellar figures when boosted by the Magnificent 7.


Chart 8: Performance of the style factors in 2023, removing the “Magnificent 7”

Source: Unigestion, MSCI. Data as of 30.09.2023

Consequently, our strategies – which combine a sophisticated low risk approach associated with adequate controls on Quality, Value and Momentum – are very well positioned to navigate an environment where resilience will be key, as we evidence in the following section.

Riding the quiet wave ?

Across our defensive strategy suite, our portfolios have navigated the turbulence of 2023 pretty well, even if our global strategy suffered – at least for now – from its strong underweight within the Magnificent 7.

Chart 9: Performance of Unigestion flagship funds in 2023

Source: Unigestion, MSCI. Data as of 30.09.2023. Past performance is not indicative of future results. Performance is stated gross fees, in the respective base currency of each strategy.

Hence, we have delivered pretty decent results so far this year (Chart 9), with:

    • Our ACWI strategy delivering almost 100% of the rise of the market ex Magnificent 7.
    • Our Europe/Eurozone strategies delivering solid upside capture in a strong up market (and even more solid when taking ASML – the European cousin of the Magnificent 7 – out of the picture)
  • Our Emerging Markets strategy delivering very strong performance, by capturing the solid returns of emerging markets ex-China, and defensive plays within China.

A good entry point for “Low Vol” investors ?

As we are now in a regime where interest rates should stay higher for longer, we believe our strategies should perform well for the coming quarters/years.
Looking at the full rate of interest rates cycle, we know our strategies tends to suffer during the first weeks/months when interest rates start to increase. However, this is usually short lived and then rising interest rates do not have much of an influence over relative performance.
Nonetheless, a regime where interest rates stabilise at a high level is usually favourable to our strategies as high interest rates penalise the valuation of high growth companies (given the value of their future earnings is strongly diminished by a high discount rate). Companies which are by nature more defensive, with less uncertainty around their earnings growth, are becoming very attractive for investors as visibility on the true value of their earnings is much greater.

The second effect is coming from leverage. Many companies usually attempt to benefit from low interest rates periods to boost their profitability by increasing leverage and using it either to fuel capex, or to return capital to investors through share buyback programs. However, when we shift to a high interest rate regime, those companies face a significant impact on the serving of their financial debt, combined with a more restricted ability to refinance their leverage because of tighter financial conditions. This is typically the type of companies our strategy seeks to avoid; hence our relative performance usually benefits from avoiding those ailing stocks.
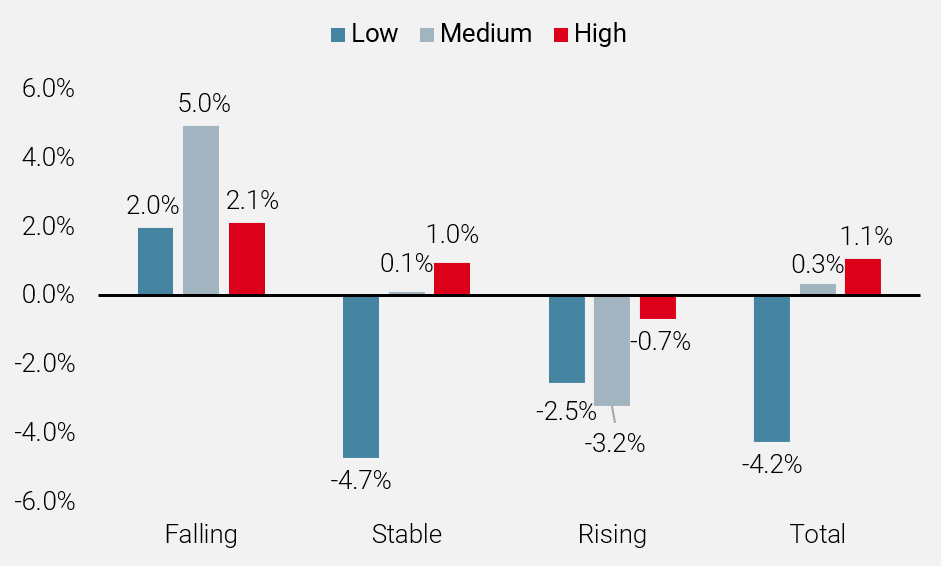
For example, below is the realised performance (average monthly excess return) of our European equity strategy during periods of low/medium/high interest rates, and also looking at the three-month trend (rising –stable – falling). We clearly see (Chart 10) that high interest rates create a positive regime, and falling interest rates are also very supportive.


Chart 10: Historical behaviour of our European strategy during various rate regimes

Source: Unigestion, Bloomberg. Data as of 5 October 2023. Average relative strategy of our European strategy, gross of fees, over the next 3 months versus MSCI Europe TR Net USD, from 31.05.2004 to 30.09.2023. Low = Yields below 2%. Medium = Yields ranging from 2% to 4%. High = Rates above 4%. Falling Yields: Yields falling by more than 30bps over the next 3 months. Stable Yield. Yields being in a range of +/-30 bps versus current yield over the next 3 month. Rising Yield :yields increasing by more than 30 bps over the next 3 months.